Explore the software
PRIMER 7 with PERMANOVA+
Visualise multivariate data with ease. Minimise assumptions. Test hypotheses. Achieve a holistic synthesis. Reveal hidden structures. Maximise your insights.
Robust
Non-parametric methods in PRIMER make few, if any assumptions. They are intuitive, transparent, and easy to implement, interpret and explain.
Widely Applicable
PRIMER tools are used by thousands of researchers globally, in marine, terrestrial and freshwater ecology, forestry, soil science, genetics, fisheries, environmental science, aqua-/agri-culture, microbiology, medicine, social science, psychology, economics, and more.
Highly Acclaimed
A global ‘standard’ in software tools for multivariate analysis in biodiversity and community ecology, PRIMER has been developed and led by highly-cited globally-recognized academic researchers for the past 30 years.
PRIMER 7 with PERMANOVA+ provides a wide range of graphical and analytical routines for examining multivariate data, particularly species-by-samples data from community ecology.
Virtually any multivariate dataset can be analysed using PRIMER. The unifying feature is that data may be reduced to an appropriate triangular matrix of resemblances among every pair of samples. Clustering and ordination techniques are then able to display relationships among samples, and robust permutation tests are used to test hypotheses.
Ecological data are typically abundances of species (counts, biomass, cover or presence/absence) from fundamental or environmental studies, including biological monitoring. Though assemblage data are a primary focus, the package is equally applicable to other types of multivariate data, such as genetic nucleotides (e.g., SNPs), allele frequencies, amino acids or proteins. PRIMER also caters for physical or chemical variables, which can be analysed in their own right or used to examine co-variation of biotic changes with physico-chemical conditions.
What is more, the PERMANOVA+ routines allow multivariate (or univariate) variation to be analysed in response to multi-factorial sampling designs, complex experiments and/or gradients. The data cloud is modelled directly in the space of a chosen resemblance measure, retaining fundamental flexibility. Formal inference is achieved through accurate construction of relevant test-statistics and sophisticated permutational algorithms, making it distribution-free.
Features
Easy manipulation of data and results
- Work on multiple datasets, graphics and output files simultaneously within a single interactive & intuitive graphical Windows environment.
- Keep track of all your work easily using the tree-like navigation pane.
- Input/output data from Excel, .csv, .txt or 3-column format.
- View and change the colours, fonts, look & feel of your plots and graphics.
- Copy/print/export results to .jpg, .emf, .tif, .gif, .png, .bmp or .rtf files.
- Identify important subsets of samples or variables
- Merge or split data on specified criteria
- Define group structures for tests and displays.
- Handle large data sets (subject only to available memory).
- Unleash in-built Wizards for matrix displays, heat maps and core analyses.
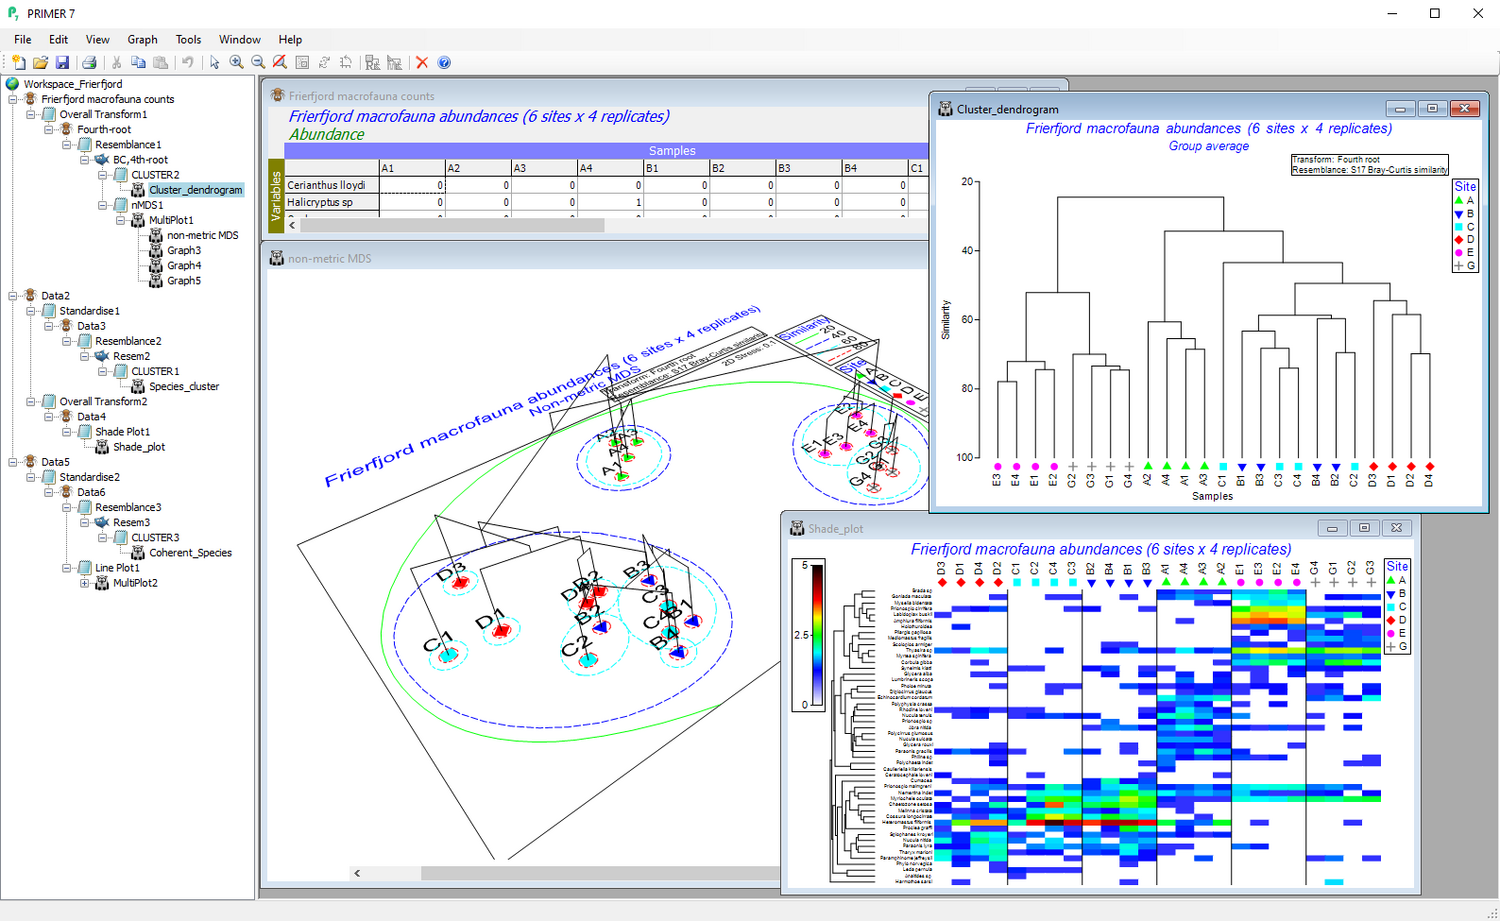
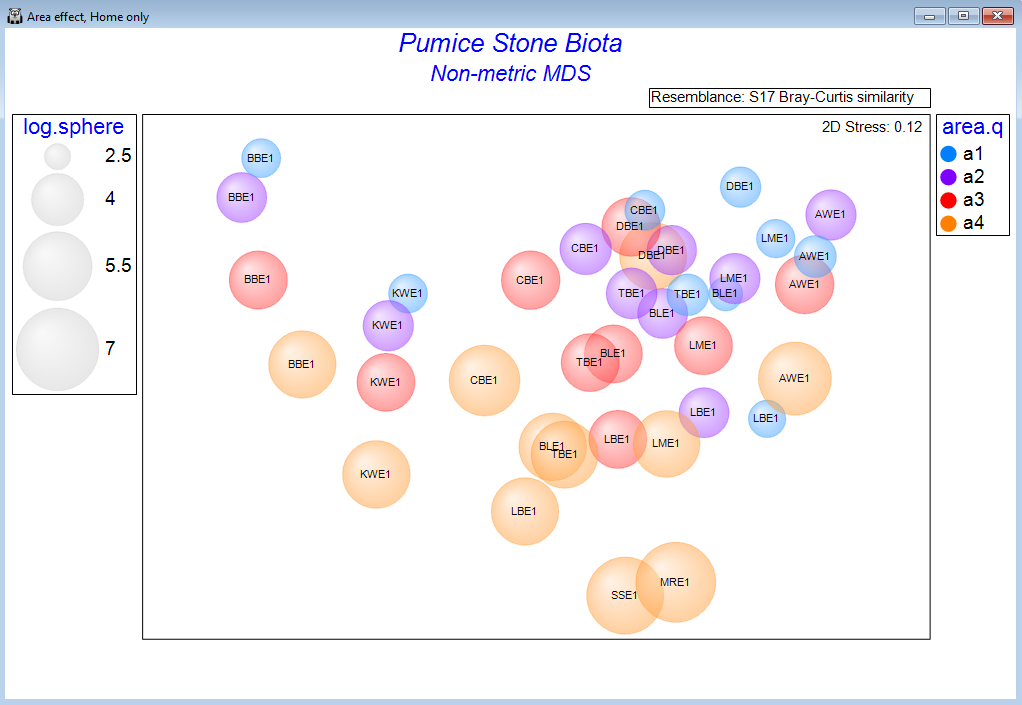
Ordination methods
- Visualise high-dimensional data in 2d or 3d.
- Access a host of unconstrained ordination techniques, including principal components analysis (PCA), principal coordinates analysis (PCO), non-metric multi-dimensional scaling (nMDS), metric MDS (mMDS) or threshold-metric (tmMDS).
- Customise text, colours and symbols.
- Add essential information with overlays, such as clusters, trajectories, bubbles, images, vectors, or minimum spanning trees.
- Clarify and test hypotheses of interest using constrained ordination methods, including dissimilarity-based redundancy analysis (dbRDA), canonical analysis of principal coordinates (CAP), or unify analyses of disparate variable sets with combined MDS.
- Use bootstrapping to show confidence regions for averaged data on MDS plots.
- Spin, expand, rotate, animate, save and share your ordination plots.
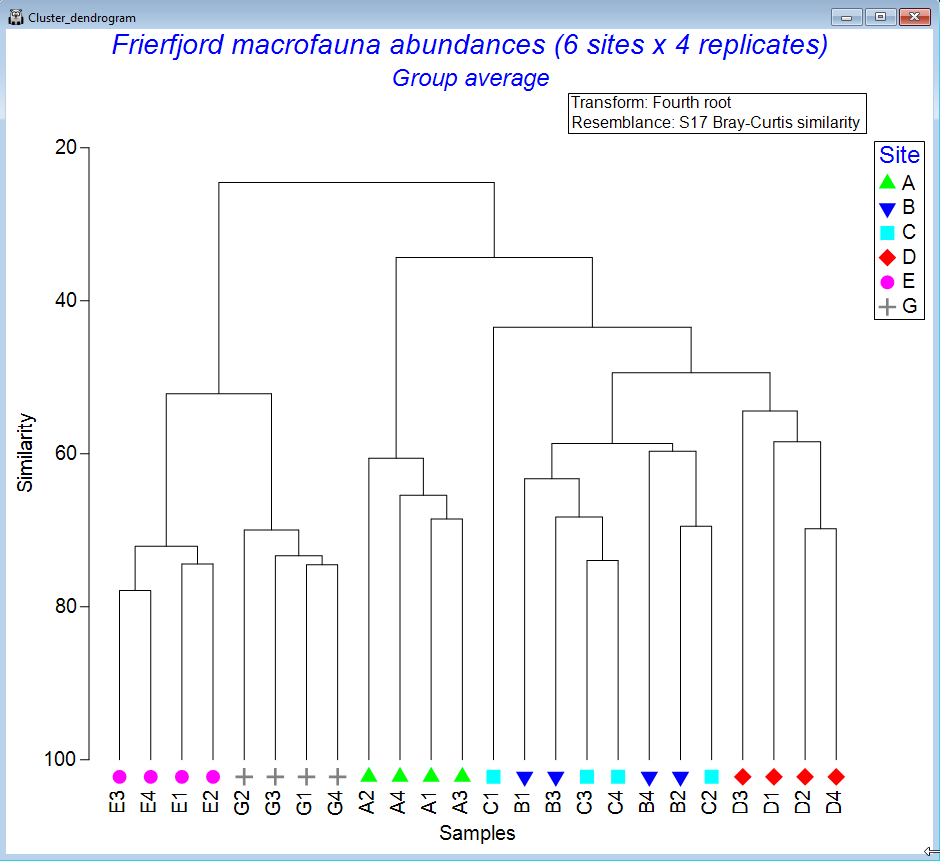
Cluster analyses
- Perform hierarchical agglomerative clustering into groups of samples (or groups of variable/species
- Single, complete, group-average or flexible-beta linkage options.
- Plot dendrograms and create cophenetic distance matrices.
- Customise, rotate, collapse, zoom in, or print results to capture all the finer details.
- Use similarity profiles (SIMPROF) and associated permutation tests to identify coherent groups of samples or species.
- Divisive clustering methods can be unconstrained (UNCTREE) or constrained by environmental (or other) variables (LINKTREE).
- Achieve non-parametric k-means clustering (krCLUSTER) for a specified number of groups, or allow an appropriate number of groups to be chosen via an automated SIMPROF cut-off criterion.
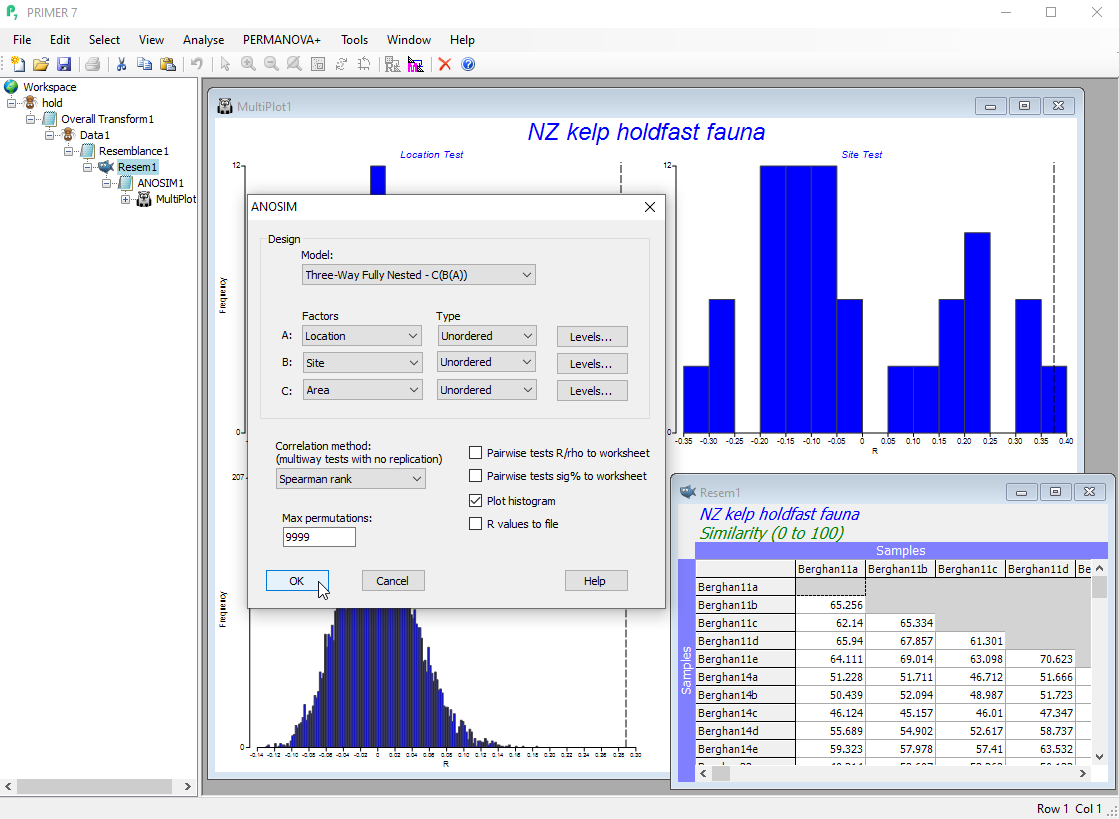
Non-parametric permutation tests
- Use analysis of similarities (ANOSIM) to test for differences among groups of multivariate samples from different times, locations, experimental treatments, etc.
- ANOSIM allows fully non-parametric tests of up to three factors (each able to be specified as either ordered or unordered), in any three-way design, including nested hierarchies.
- Examine the relationship between two resemblance matrices in a non-parametric Mantel test (RELATE).
- Generate model matrices to test hypotheses of serial or cyclical change (e.g., seasonal rhythms) in community structure through time and/or space.
- Build and test hypotheses for second-stage associations to examine consistency in patterns among whole sets of resemblance matrices (2STAGE).
Semi-parametric permutation tests
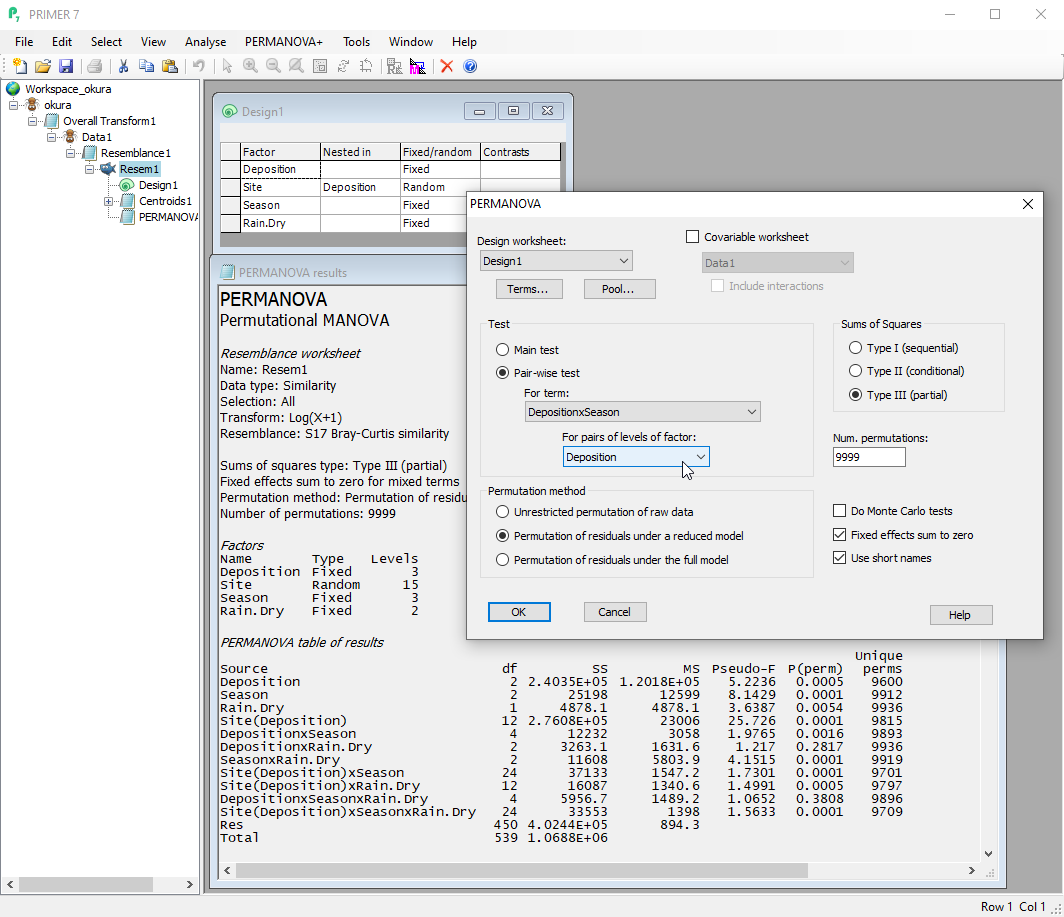
- Analyse multivariate data in response to complex multi-factorial experimental/sampling designs, including interaction terms, using semi-parametric permutational multivariate analysis of variance (PERMANOVA).
- Direct partitioning of multivariate data, based on a resemblance measure of choice. Use Euclidean distance to obtain classical partitioning results.
- Multi-factorial designs, interactions, fixed or random factors, nested or crossed with one another, asymmetrical designs, quantitative covariates.
- Automatically identifies all terms implied by a given design, with the ability to pool or remove terms.
- Test-statistics constructed using scrupulous attention to the details of your design and logic, based on expectations of mean squares (EMS).
- All p-values obtained by advanced permutation techniques that allow for multi-level designs and account for all other terms in the model for powerful, rigorous, distribution-free results you can trust.
- Pairwise comparisons and user-specified contrasts.
- Estimation of effect sizes / variance components.
- Distances among centroids reveal salient patterns in factorial structures.
- Unbalanced or unreplicated designs (split plots, randomized blocks, etc.); choose the Type of SS.
Relate species/biota to environment
- Relate matrices to one another (e.g., biotic to environmental) or identify subsets of (environmental) variables which together produce a ‘BEST’ Mantel-type match to a given (biotic) resemblance matrix.
- Use LINKAGE trees to find optimal splits of biotic (response) data through environmental or spatial constraints.
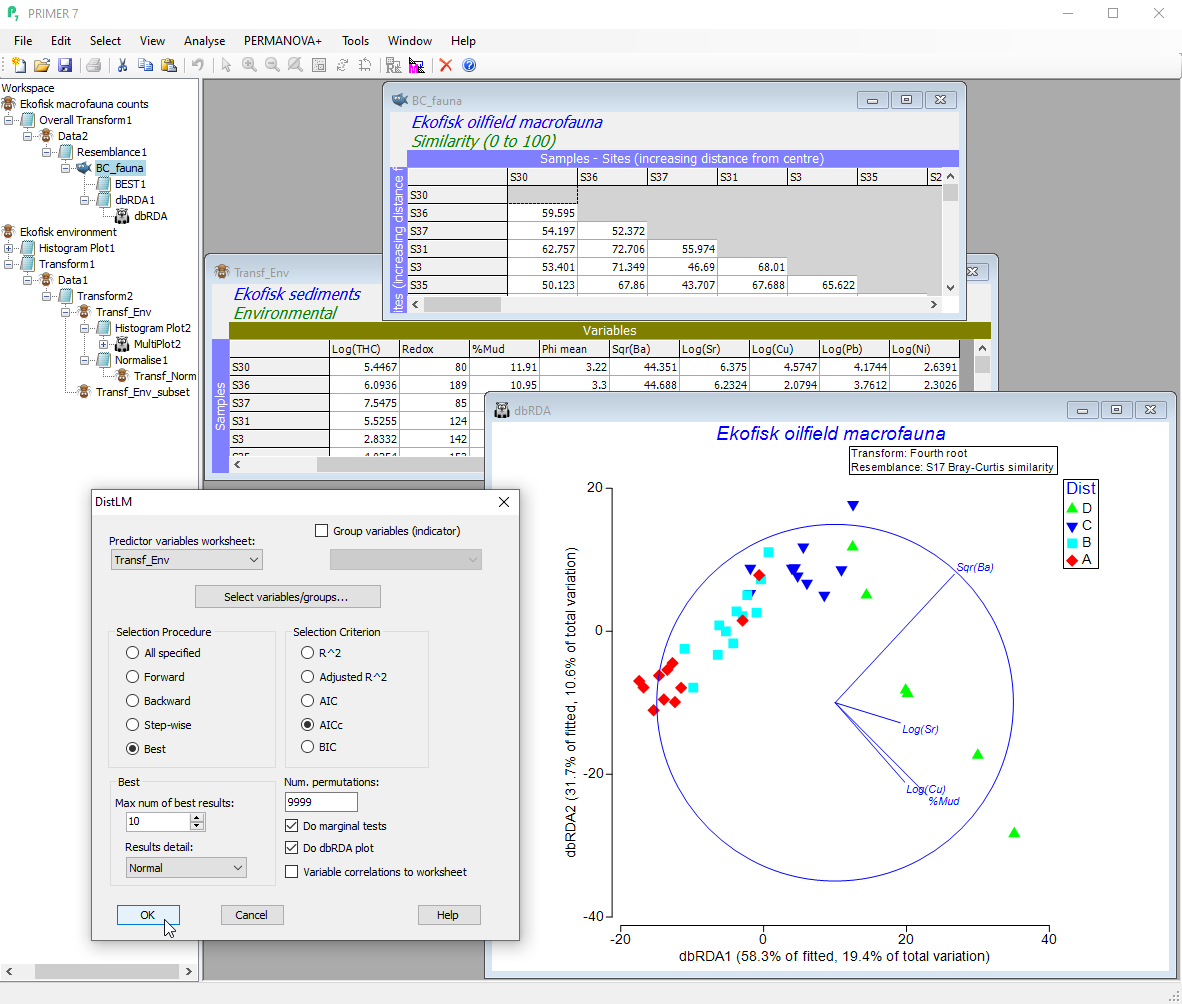
- Discover how much variation in a (biotic, response) multivariate data cloud is explained by one or more explanatory (environmental, predictor) variables using dissimilarity-based multivariate multiple regression (DISTLM).
- Marginal and sequential permutation tests for individual regressors.
- Variable selection using forward, backward, step-wise or “best” methods.
- Multivariate analogues to information criteria (AIC, AICc, BIC, adjusted R-squared) for model comparisons.
- Analyse sets of variables in groups or individually, and visualise fitted values with dissimilarity-based redundancy analysis (dbRDA).
- Explore inter-relationships between two sets of variables using dissimilarity-based canonical correlation analysis (CAP).
Characterise groups / gradients / predictive modeling
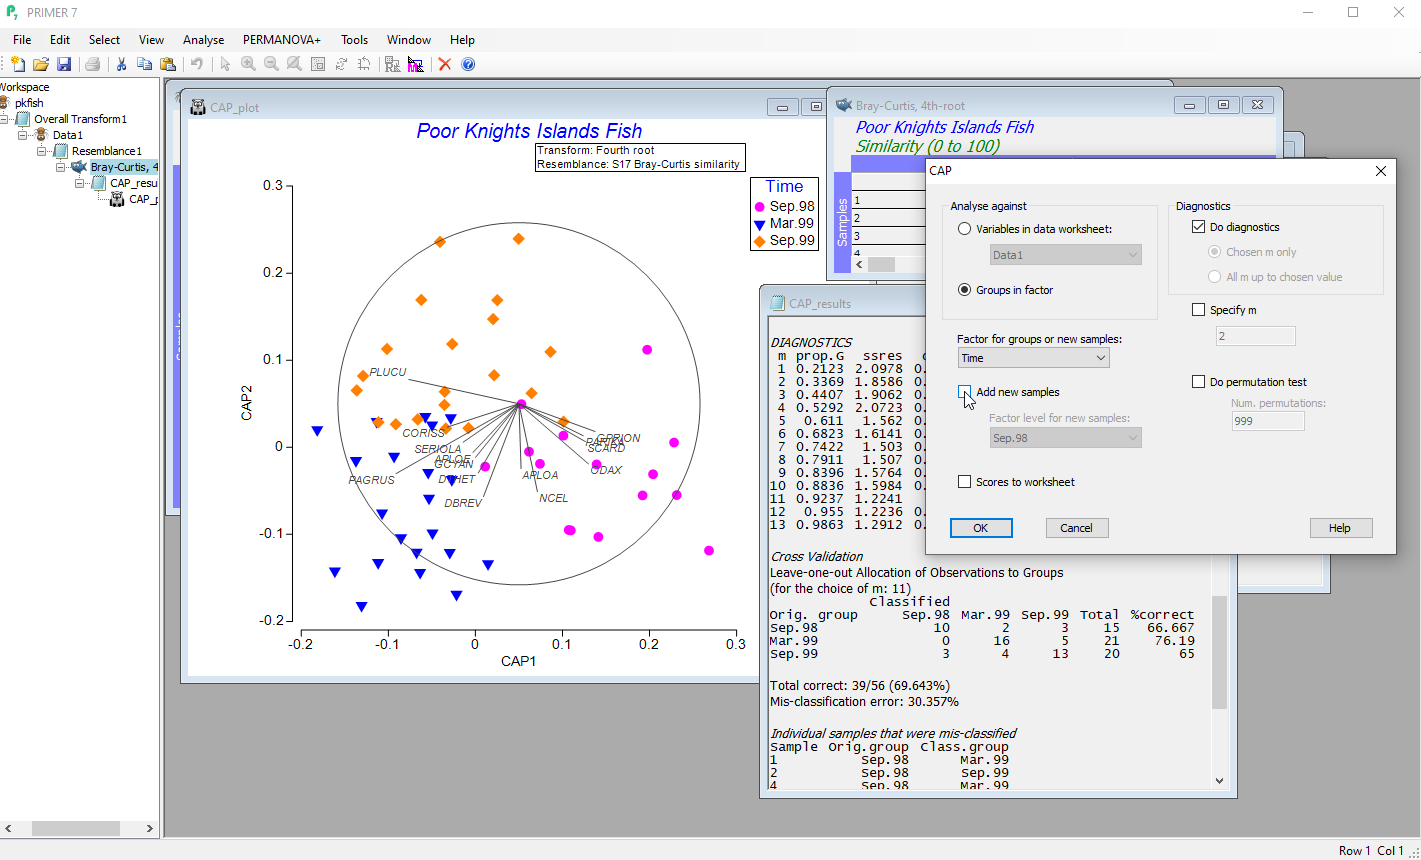
- Perform discriminant analysis in the space of a chosen resemblance measure using canonical analysis of principal coordinates (CAP).
- Refine your interpretations by using SIMPER to identify species that contribute to dissimilarities/similarities between/within groups.
- Use similarity profiles (SIMPROF) and associated permutation tests to identify coherent groups of samples or species.
- Highlight important species using shade plots / heat maps, superimposing clusters or maintaining specified groups (or orderings) of samples and/or species.
- Leave-one-out cross-validation gives a statistical measure of the distinctiveness of a priori groups.
- Allocate new samples to existing groups, or predict the positions of new samples along continuous gradients.
- Excellent for environmental monitoring programs, morphological analyses of characters, or validation of clustering outcomes with new data.
Analyse Diversity
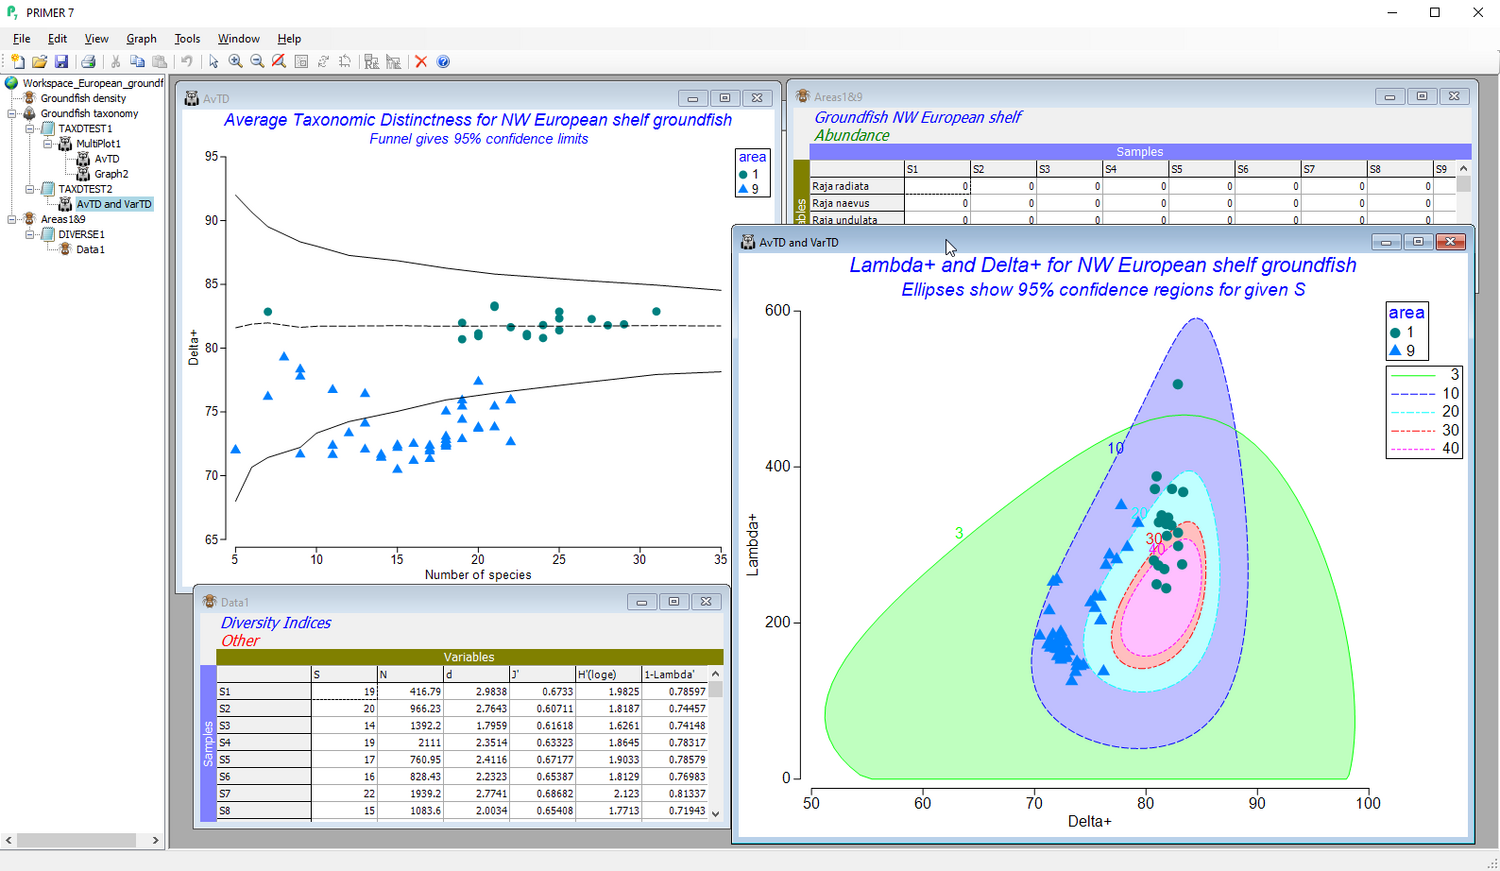
- Use taxonomic, functional and/or phylogenetic information to inform biodiversity assessments. Test against master lists using sub-sampling algorithms.
- Test the homogeneity of within-group multivariate dispersions on the basis of any resemblance measure (PERMDISP). Excellent for studies of ecological or genetic beta diversity.
- Calculate a multitude of classic and novel diversity indices or summary statistics of individual variables, with aggregation tools for analysing data at higher taxonomic levels.
- Access a wide choice of flexible plotting functions for individual variables: line, histogram, scatter, bar, box, means, surface or Draftsman plots.
- Ecology-specific tools are at your fingertips, such as dominance plots, geometric class plots, or abundance biomass curves (ABC).
System requirements
PRIMER software is a device-dependent installation, and not for terminal servers.
Note: PRIMER will not run natively on Apple Mac OSX, but it is possible to use it via virtualization software or Boot Camp.
| OS | Windows 10 |
| CPU | Modern Intel or AMD processor |
| RAM | 8 GB or more |
| HD space | 100 MB or more |

"More than a software package; it puts statistically powerful tools, based on proven and robust approaches, into the hands of ecologists."

"PRIMER software provides a proven and trustworthy tool… The user interface and graphic(s) encourage exploration to better understand data."

"I appreciate the detail in the software manuals & tutorials. The ecological examples that give context are well-explained & helpful!"

"I really enjoy using PRIMER not only for my own research, but also for teaching the next generation of researchers."

"In undergraduate teaching, the PRIMER wizards allow us to focus on biological interpretation, not spending the lab generating outputs."

"No piece of software has been more important to me. Keeps users in the driving seat, understanding how analyses are influencing results."
"PRIMER with PERMANOVA+ has been an essential tool for our work and has greatly advanced our ability to analyze and understand complex ecological datasets."

"PRIMER is like a colleague to me. One who understands what I want to do."

"A powerful & intuitive tool for interpreting & communicating patterns in data in a 'language', understandable by both scientists & managers."